Fibonacci Trading Guide 2022 – Learn a Fibonacci Trading Strategy Today!
Seasoned traders will rely on technical indicators with the view of predicting whether an asset is likely to rise or fall in the short term. One of the most popular indicators is that of the Fibonacci retracement.
In this guide, we explain how Fibonacci trading works in a user-friendly manner and walk you through the process of deploying this strategy at a top-rated broker.
Best Fibonacci Trading Platforms 2022 List
In order to execute a risk-averse Fibonacci trading strategy – you will first need to open an account with a trusted brokerage site. To point you in the right direction – below you will find the best Fibonacci trading platforms in South Africa.
- eToro: Best Fibonacci Trading Platform for Beginners (ProCharts)
- Capital.com: Best Fibonacci Trading Platform for Advanced Strategies (MT4)
We review both the platforms listed above further down in this Fibonacci trading guide.
Fibonacci Trading Platforms Fees Comparison
When deploying a Fibonacci trading strategy at an online broker, you’ll need to factor in fees and commissions. Below we summarize the main charges to expect when trading at a top-rated Fibonacci investment platform.
| Stock Fees | Crypto Fees | Forex Fees | Deposit/Withdrawal Fee | |
| eToro | 0% | Spread only | Spread only | 0.5% / $5 |
| Capital.com | 0% | 0% | 0% | None |
Fees and commissions can change at any time, so be sure to check this yourself before signing up.
Fibonacci Trading Beginners Gudie
If you’re completely new to Fibonacci trading, we are now going to walk you through the process step-by-step.
Let’s start by discussing the basics of how Fibonacci trading actually works.
What is Fibonacci Trading?
First and foremost, Fibonacci trading refers to the use of a key technical indicator – the Fibonacci retracement. Like all technical indicators utilized by seasoned traders, the Fibonacci retracement looks to identity potential pricing trends. In theory, the indicator can be used on any financial instrument – whether that’s stocks, cryptocurrencies, forex, or indices.
In its most basic form, the Fibonacci retracement will look at the relationship between two pricing levels. For all intents and purposes, this will typically be the peak and trough of a current trend.
Once you have selected the Fibonacci retracement indicator on your chosen platform, it can help identify support and resistance lines. It will do this by displaying a set of key ratios on your charting screen.
At a minimum, this will typically include the following ratios:
- 23.6%
- 38.2%
- 50%
- 61.8%
- 100%
The above ratios will help identify a possible retracement of an upward or downward trend. For those unaware, the retracement of an asset refers to a trend that has temporarily reversed.
For example:
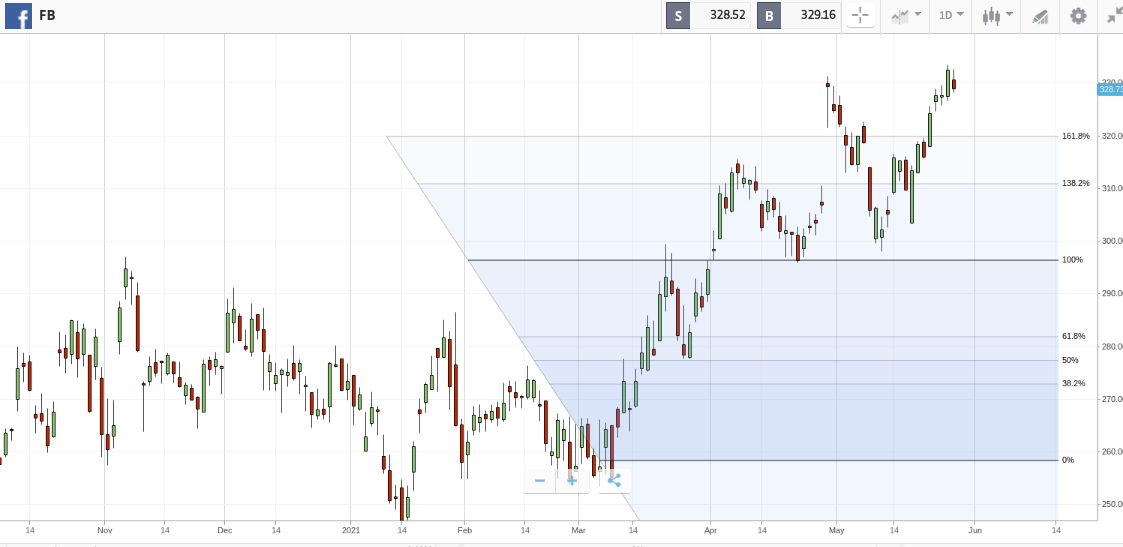
- Let’s suppose that Facebook stocks are currently in a bullish upward momentum.
- This is because Facebook recently announced that it smashed through its quarterly revenue targets by 17% and operating margins have increased by 12%.
- As a result, over the past seven days, Facebook stocks have increased by 11%
- However, over the past 24 hours, the stocks have gone down by 2% – which is the first losing day since Facebook announced its better-than-expected earnings report
As per the above example, the Fibonacci trading indicator would seek to identify whether this 2% drop over the past 24 hours is a short-term market correction or a sign that the upward trend is over.
- If the Fibonacci retracement points to a market correction, then you could purchase Facebook stocks at a 2% discount. This is because the tool indicates that the upward trend on Facebook is likely to resume.
- If, however, the Fibonacci retracement points to a trend reversal, then you might be wise to enter the market with a short-selling position.
This is why the Fibonacci trading strategy is so popular – as it allows you to profit from both rising and falling markets. In other words, you are looking to trade alongside the current market trend – irrespective of which direction that might be.
Strategies for Trading Fibonacci Retracements
There are many ways in which seasoned traders use Fibonacci retracement levels. Assuming that you are learning about Fibonacci trading for the very first time – we’ll start you off with some basic strategies.
Drawing Fibonacci Lines
On the one hand, understanding the intricacies behind the Fibonacci retracement indicator is super complex. This is because the indicator requires advanced mathematical equations to come to a conclusion regarding the trend line of an asset. Fortunately, online trading platforms have simplified the process – as it’s now just a case of knowing how to use drawing tools.
Identifying an Upward or Downtrend Trend
The first part of the process will require you to identify whether the financial instrument in question is in an upward or downtrend trend. This is relatively straightforward, as you can use brokerage pricing charts to your advantage.
This might come in the form of a web-trading platform like eToro – where you will have access to real-time prices via Pro Charts. Or, you might use a broker like Capital.com that allows you to connect your account to MT4.
Either way, once you have identified the current trend direction, you can then move on to the next step of drawing your high and low points.
Draw High and Low Points of a Trend
Now that you know whether the asset in question is in a bullish or bearish market, you then need to assess whether a market correction has occurred or if the wider trend is about to reverse. In order to do this, you’ll need to select the Fibonacci retracement indicator on your chosen platform.
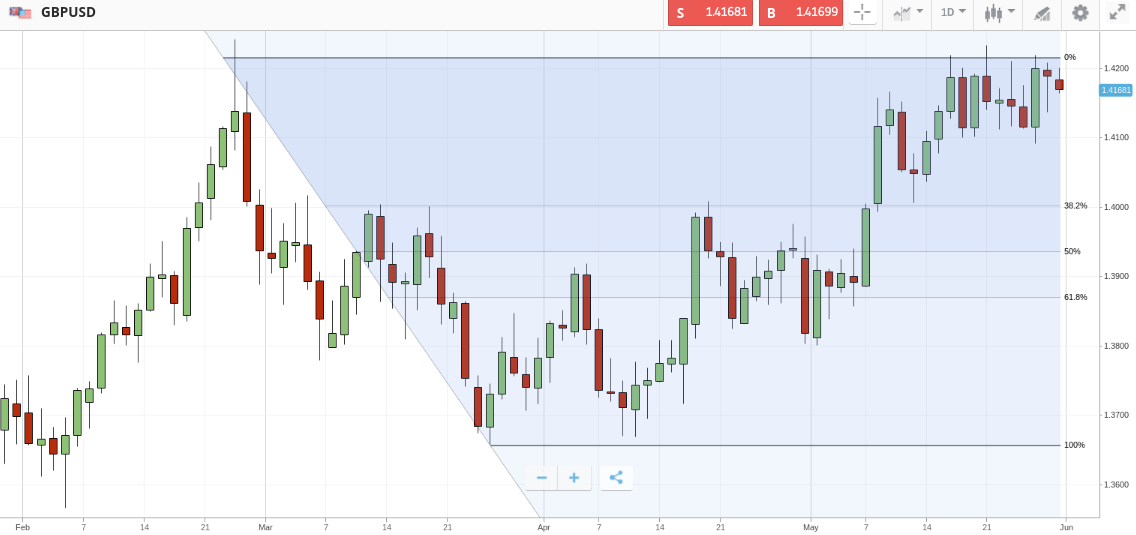
Then, you need to expand the drawing trend lines on your chart to cover the high and low price of the short-term trend. For example, let’s suppose that GBP/EUR hit 52-week highs of 1.4250 and then quickly bounced back to a support level of 1.4170 by the end of the trading day.
The aforementioned prices could illustrate useful high and low points – so you should draw your Fibonacci retracement trend lines accordingly.
Assess Ratios
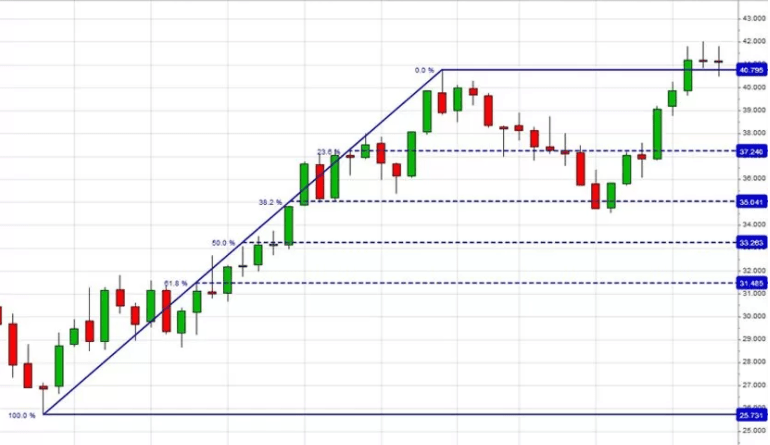
Once you have drawn your Fibonacci retracement trend lines based on the identified high and low prices, you will be able to view the respective ratios. For example, the image below shows the Fibonacci retracement indicator being used on crude oil prices.
We can see that there was a prolonged upward trend when oil hit $25.7 per barrel. This upward trend continues until the price of oil hit $40.7 – where it then retracted down to $35.0. At the price of $35.0, we can see that this aligns with the Fibonacci retracement ratio of 38.2% – which is a key pricing point.
At this level, a simple Fibonacci trading strategy would tell us that this price drop is short-lived and thus – is a market correction. In turn, this Fibonacci trading strategy would tell us to go long by placing a buy order at the 38.2% level.
As the chart shows us, the Fibonacci retracement was correct in this instance. Not only did the price of oil resume its upward trend, but it broke past the previous high of $40.7.
Helpful Fibonacci Trading Tips
Make no mistake about it – having a solid Fibonacci trading strategy in place can give you the best chance possible of consistently entering and exiting the market at the right time. With that said, learning how to use the Fibonacci retracement tool effectively can take a long time to truly master.
To ensure you avoid making costly errors, below you will find some helpful Fibonacci trading tips.
Use the Fibonacci With Other Indicators
Any seasoned trader will tell you that a position should never be entered based on a single technical indicator alone. The Fibonacci retracement is no different in this respect. Sure, the tool might highlight that an upward trend is in a temporary market correction – which offers an excellent opportunity to purchase an asset at a discount.
However, before placing a trade, you should attempt to find confirmation of your findings. The best way to do this is to use another technical indicator.
- For example, let’s suppose that you are using a Fibonacci trading strategy on EUR/USD.
- As per your trend tool, the 38.2% retracement level is telling you to go short on EUR/USD at 1.2287.
- You want confirmation of this, so you also deploy a technical indicator called the stochastic oscillator.
- This is a momentum indicator that seeks to identify whether an asset is in overbought or oversold territory.
- After deploying the stochastic oscillator, the indicator tells us that EUR/USD is overbought.
- As such, this is the confirmation that you need to enter a short-selling position on the forex trading pair.
Some trading platforms will give you access to dozens of useful technical indicators, so you have plenty of opportunities to verify the findings from your Fibonacci system.
Be Careful of Fibonacci Trading Software
In performing a simple Google search for Fibonacci trading software, you will be presented with a significant number of results. This is because there are hundreds of providers in the online space that claim to offer Fibonacci trading software that can automatically detect when to enter and exit the market.
In fact, many providers go one step further by claiming that their Fibonacci trading software can place trades on your behalf. This is not too dissimilar to an automated forex robot. Although algorithmic trading is popular in South Africa, the vast majority of robots cannot consistently outperform the market.
This is why you should avoid automated Fibonacci trading software, as there is every chance that the robot will burn through your trading balance. Instead, you should learn the ins and outs of how to use the Fibonacci retracement tool manually.
Don’t Discount the Fundamentals
When deploying a Fibonacci trading strategy – you are only concerned with technical indicators and pricing trends. Although this is crucial when speculating on financial instruments via a day trading approach, it’s really important not to forget about the fundamentals.
By this, we mean real-world news events that can and will make technical indicators like the Fibonacci retracement somewhat redundant – at least in the short term.
- For example, let’s suppose that you are trading Amazon stocks.
- Over the course of the past few weeks, the stocks have failed to break through new all-time highs of $3,554 per share.
- As per your usage of the Fibonacci retracement tool alongside other technical indicators, everything is pointing towards another bounce back on the approach to the $3,554 level.
- However, Amazon releases its quarterly earnings report – which smashes through all market expectations.
As such, this results in Amazon stocks entering a strong upward trend and thus – breaks through the identified resistance levels. In other words, fundamental data will almost always supersede technical indicators like the Fibonacci retracement – so do bear this in mind.
Best Platforms for Fibonacci Traders Reviewed
So now that we have covered the best Fibonacci formula trading strategies and tips, we now need to discuss brokers. After all, you will need to ensure that your chosen broker not only offers the Fibonacci retracement indicator, but your preferred markets, too. You also need to consider fees and commissions, supported payment types, and regulation.
Below you will find a selection of the best platforms for Trading Fibonacci retracements.
1. eToro – Best Fibonacci Trading Platform for Beginners (ProCharts)
If you’re a complete newbie attempting the Fibonacci trading system for the very first time – eToro is the best brokerage site on the table. This heavily regulated platform – which boasts more than 20 million client accounts, is ideal for beginners with little to no knowledge of online trading.
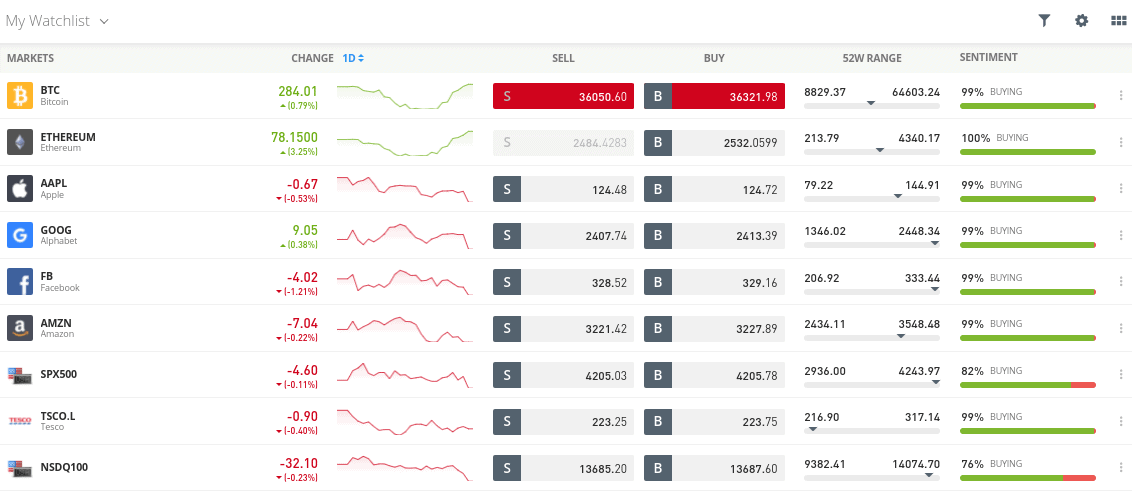
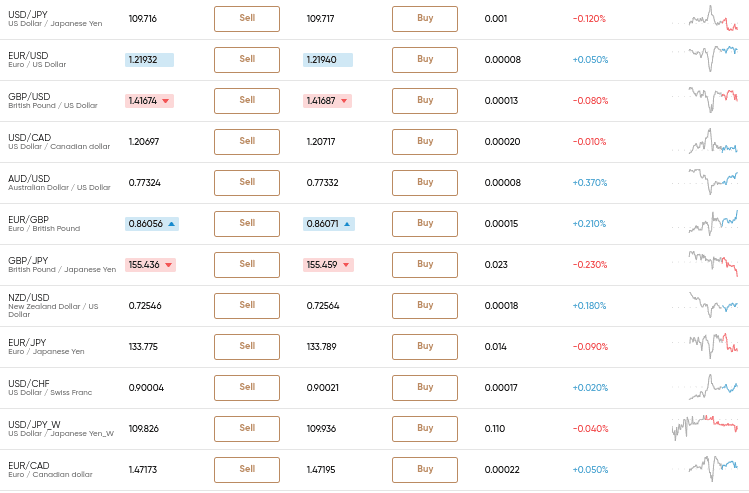
Supported markets at this top-rated broker include thousands of stocks and ETFs from 17 international exchanges. These two asset classes can be traded on a 100% commission-free basis. You can also access forex, commodities, cryptocurrencies, and indices on a spread-only basis. We also like the fact that eToro supports low stake sizes, with minimums starting at just $25 on digital currencies and $50 on all other markets.
Once you have chosen an asset to trade, eToro offers an abundance of technical indicators and chart drawing tools. This is offered via integration with ProCharts, which is especially popular for inexperienced traders. Among heaps of other indicators, you can deploy a Fibonacci trading strategy with ease. Placing orders is also simple at eToro, as the platform is free from complex trading jargon. If you are yet to get your head around the Fibonacci system, you might consider the eToro Copy Trading feature.
This promotes passive trading, as you will be selecting a seasoned investor to copy. Then, any buy or sell positions that they place will be reflected in your own eToro account. In terms of getting started with eToro, you can open an account and deposit funds with a debit/credit card or e-wallet in minutes. The broker is regulated by the FCA, ASIC, and CySEC – so there is no concern about the safety of your funds.
Pros:
- Buy shares without paying any commission or share dealing charges
- 2,400+ shares listed on 17 international markets
- Trade forex, commodities, index funds, cryptocurrencies, and more
- Social and copy trading
- Mobile trading app
- Regulated by the FCA, CySEC, and ASIC
Cons:
- Not suitable for advanced traders that like to perform technical analysis
67% of retail investors lose money trading CFDs at this site
2. Capital.com – Best Fibonacci Trading Platform for Advanced Strategies (MT4)

This includes dozens of technical indicators – such as the Fibonacci retracement tool. Furthermore, when using Capital.com via MT4, you will also have the option in deploying an automated trading robot. This means that the robot can identify Fibonacci pricing levels on an autonomous basis, allowing you to sit back and trade passively. Irrespective of which strategy you take, Capital.com is a 100% commission-free broker.
This means that the only trading fee that needs to be factored into your strategy is the spread. When it comes to supported markets, this top-rated platform offers everything from stocks, ETFs, and indices to forex, commodities, and cryptocurrencies. All markets can be traded alongside leverage. Plus, Capital.com supports both long and short positions – which is crucial when engaging in Fibonacci levels trading.
In terms of safety, Capital.com is regulated by two reputable bodies – the FCA and CySEC. We like the fact that the broker requires a very small minimum deposit of just $20 – which you can meet with a debit/credit card or e-wallet. Or, you might hold back on making a deposit initially and instead – trade via the free Capital.com demo account. This allows you to backtest your Fibonacci trading strategy without needing to deposit or risk any money.
Pros:
- Educational app for new traders
- AI assistant identifies your weak points
- Trade ideas generated daily
- Excellent charting and analysis interface
- No inactivity fees
- 100% commission free trading
Cons:
- Cannot build custom trading strategies on the native platform
75.26% of retail investor accounts lose money when spread betting and/or trading CFDs with this provider.
How to Get Started with the Best Fibonacci Trading Broker
Ready to start your Fibonacci trading strategy from the comfort of your home? If so, we are now going to walk you through the account set-up process with eToro.
Step 1: Open Account and Upload ID
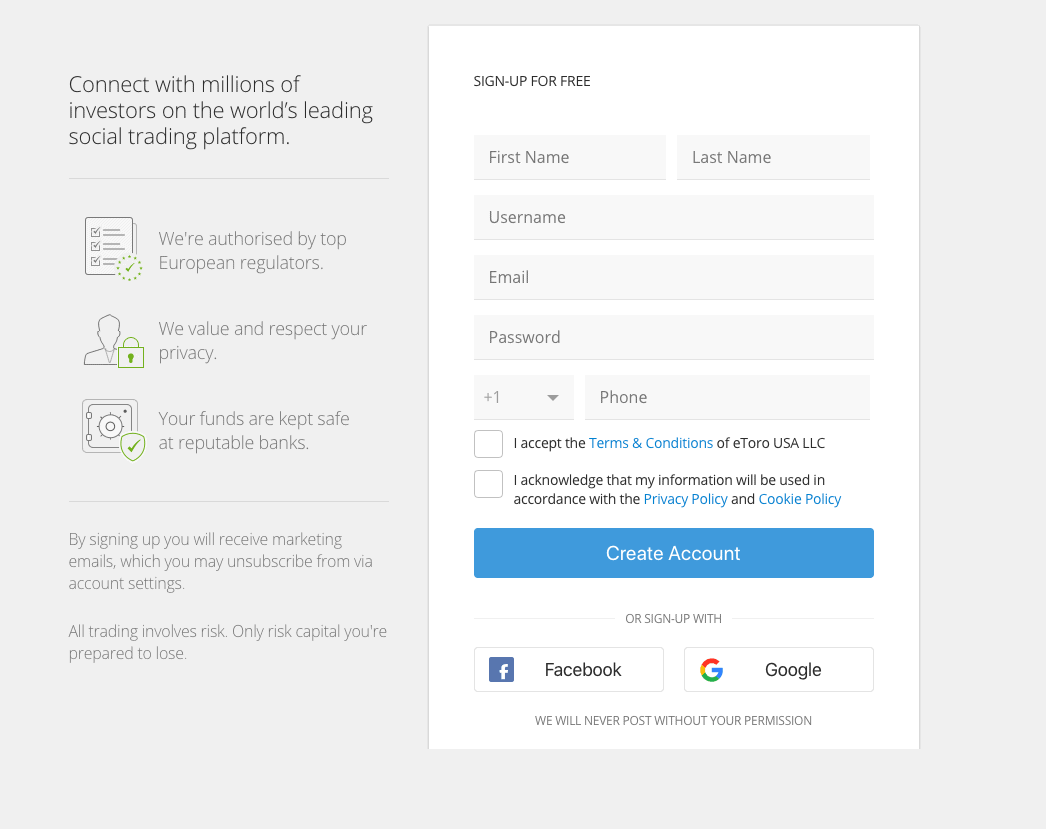
You will first need to register an account with eToro – which can be completed in less than 5-10 minutes. All you need to do is click on the ‘Join Now’ button from the homepage and enter your personal information.
67% of retail investor accounts lose money when trading CFDs with this provider.
You will also be asked to upload a copy of your government-issued ID and a recently issued utility bill or bank statement.
Step 2: Deposit Funds
You will now need to make a deposit into your eToro account. Supported payment methods include debit/credit cards and a bank transfer. You can also choose a supported e-wallet – which includes Paypal, Skrill, and Neteller.
The minimum deposit is just $200 on eToro – which is about 2,700 rands.
Step 3: Choose a Market
Now that you have made a deposit, you can deploy your Fibonacci trading strategy. But first, you will need to decide which financial market you want to trade. If you need a bit of inspiration, click on the ‘Trade Markets’ button to explore what assets eToro supports. Or, if you already know which asset you want to trade, enter it into their search bar.
Step 4: Use Fibonacci Retracement Indicator
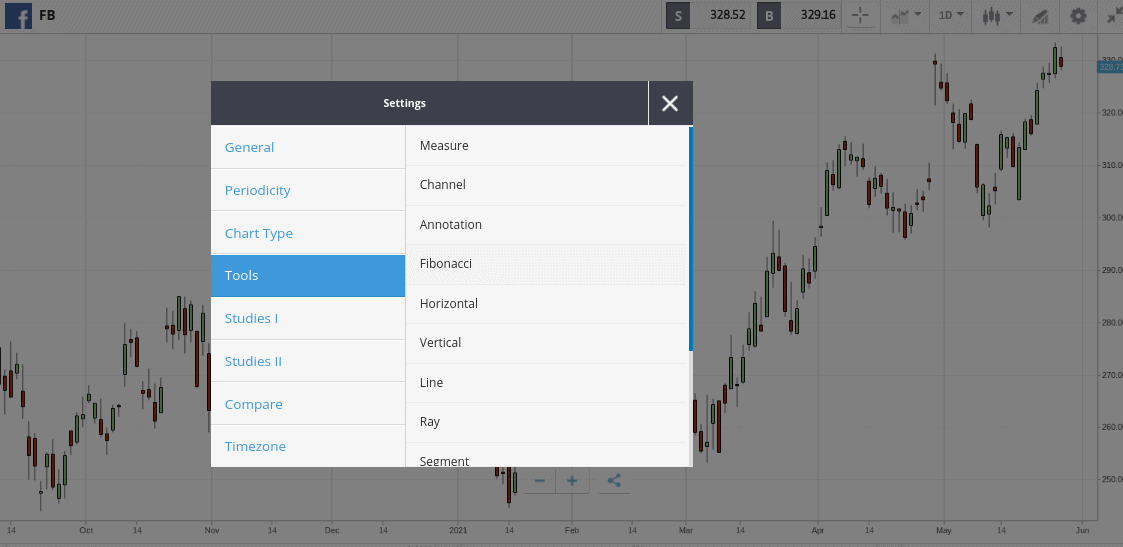
To use the Fibonacci retracement indicator on your chosen market, click on the ‘Charts’ button and then expand the screen. Next, click on the ‘Tools’ button and select ‘Fibonacci’ from the list of indicators.
67% of retail investor accounts lose money when trading CFDs with this provider.
Once you have identified your high and low points, you can then draw your Fibonacci retracement levels. Don’t forget – if you find a trend that is worth trading, make sure you get confirmation by using an alternative technical indicator. eToro offers a lot of useful tools in this respect.
Step 5: Place Order
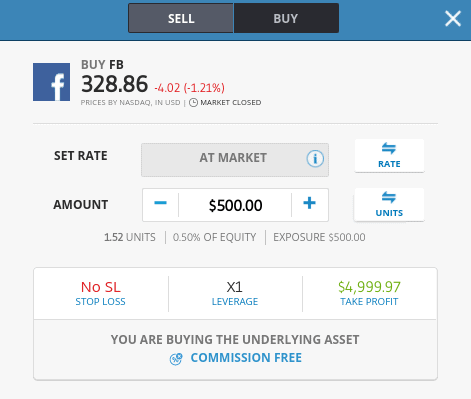
Once you are ready to trade on the back of your technical findings, click on the ‘Trade’ button to load up an order box.
Now it’s just a case of:
- Choosing from a buy or sell position
- Entering your stake
- Entering your limit, stop-loss, and take-profit order prices
Once you are happy with the information entered, click on the ‘Open Trade’ button.
Conclusion
In learning how to successfully deploy a Fibonacci trading strategy – you will give yourself the best chance possible of identifying whether a trade is in a market correction or if it is about to reverse. This essentially gives you a head start over the market, as you will be entering and exiting positions at a favourable pricing point.
However, don’t forget that the Fibonacci retracement indicator alone won’t be sufficient. On the contrary, you need to obtain confirmation of your Fibonacci strategy findings by using other technical indicators.
If you’re ready to start your Fibonacci trading endeavours right now – eToro is the best broker for the job. Opening an account takes minutes and you will be able to trade thousands of financial markets at super-low fees. The broker’s ProCharts integration is ideal for newbies – especially when it comes to the Fibonacci retracement.
eToro – Best Fibonacci Trading Broker in South Africa
67% of retail investor accounts lose money when trading CFDs with this provider.
FAQs
What is the best platform for Fibonacci traders?
How does Fibonacci trading work?
Fibonacci trading is a form of technical analysis. As the name implies, you will be using the Fibonacci retracement indicator to assess whether an identified trend is likely to resume after a brief market correction, or if it is about to reverse completely.
What is a retracement in Fibonacci trading?
A retracement in trading is when the price of an asset reverses from its current trend. When using the Fibonacci trading indicator, you need to determine whether this pullback is temporary or signs of a longer-term trend reversal.
Is the Fibonacci retracement accurate?
The Fibonacci retracement can be a great tool to identify the future direction of a financial instrument. However, you should never use the Fibonacci retracement alone. Instead, the tool is best used alongside other technical indicators to ensure you receive confirmation on your findings.
What is the best asset to use in Fibonacci trading?
A Fibonacci trading strategy can be used on any asset - as the core principals of the technical indicator remain the same.
Why do traders use Fibonacci?
Alongside several other technical indicators, the Fibonacci is a great tool to identify the current momentum of a pricing trend.
